
How to strategically plan your computing curriculum
Traditionally, curriculum planning has often looked like a linear list: Topic A leads to Topic B, which leads to Topic C. However, as educators we know that learning rarely happens in such a simple, linear way. Concepts are regularly covered in different overlapping topics, and students can often take different routes to reach the same destination.

In today’s blog we’re exploring learning graphs, a helpful tool that you can use to plan your computer science curriculum. We’ll share how they can provide educators with a clear, structured way to visualise students’ non-linear progression in a subject.
We also share our new Pedagogy Quick Read about learning graphs, which you can download for free to:
- Find practical tips on how you can use learning graphs to design your curriculum
- Read a summary of the research behind them
What is a learning graph?
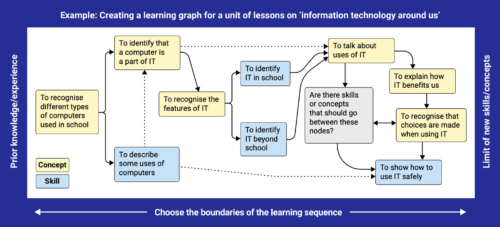
A learning graph is a visual tool for curriculum planning that moves beyond simple lists. At its core, a learning graph is a network of ‘nodes’ (specific concepts and skills) and ‘links’ (the connections between them).
Learning graphs build on research into ‘learning progressions’ and ‘knowledge maps’. They are a practical tool that educators can use to design and validate different curricula. For example, they can help teachers to:
- Visualise and map progression
- Identify curriculum gaps, so educators can shape and restructure learning experiences as necessary
- Ensure the use of consistent terminology
- Sequence learning and manage cognitive load
How to create a learning graph
Building a learning graph is an iterative process that helps you think critically about how different parts of your curriculum relate to each other.
Nodes and links
The first step in creating a learning graph is often to identify your start and end nodes. First, you consider the key concepts and skills that your learners must acquire by the end of a series of lessons. This gives you some end nodes to work towards. Then, you think about learners’ existing knowledge, to help determine your start point. You then work backwards and forwards between these points to identify the different nodes that learners need to cover to get from the beginning to the end.
Once you have determined your nodes, you add them to your graph and connect them via ‘links’ until your graph is complete. Where knowledge of particular concepts or skills is essential for learning others, you connect the nodes with solid lines. For prior learning that is helpful but not essential, you use dotted lines.
When developing a learning graph, there isn’t a specific level of granularity that you have to work towards. Progression can be as detailed or as high-level as you need. This makes them a helpful tool in creating bespoke learning experiences and curricula for learners.
Collaboration and development
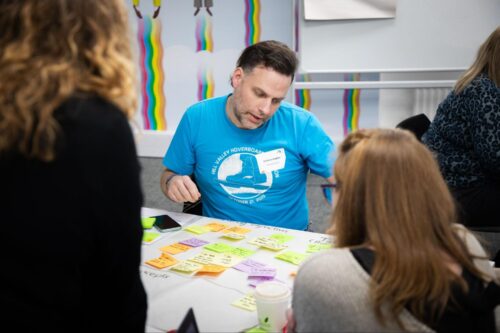
It is most effective to design learning graphs collaboratively within a small group. This allows curriculum designers to discuss their ideas and challenge each other’s thinking, which helps hone the designs.

When creating learning graphs, it can be extremely useful to use a tool that is dynamic and allows you to move elements and make changes quickly and easily. At the Raspberry Pi Foundation, our team has experimented with a range of tools, including using editable shapes in Google Slides, collaborating in Figma, and arranging sticky notes on paper. We recommend finding a tool that works for you and the educators you are working with. Although it can work, we suggest avoiding using a pen and paper if possible, as designs can quickly become messy and difficult to navigate after lots of iterations.
The process of designing learning graphs has strong links to ABC learning design and the creation of concept maps, which can also be used for curriculum planning.
Learning graphs in your teaching
Once created, learning graphs can support you to design and adapt your curricula and assess your students’ learning.
For example, to help sequence learning, you can track or predict the paths through a topic most commonly taken by learners and use this to inform your curriculum design.
If you are adapting a unit of work for a specific qualification or new context, you can prune nodes that are not relevant and add any further knowledge and skills your learners need, then use the new learning graph to guide you as you develop the unit.
Finally, you can assess which node a learner has completed, and use this to identify the next logical step in their learning, ensuring the difficulty level is always appropriate.
Using learning graphs to support analysis
Another benefit of learning graphs is that they can be combined with lots of other frameworks, for example, Bloom’s taxonomy. This allows you to better assess and validate the learning journeys you have designed, and ensure that they are suitably accessible, challenging, and relevant for your learners.

There are a number of ways that you could link your learning graphs to other frameworks, such as annotating nodes with extra information, or using colour coding.
As well as working with learning graphs for specific learning experiences, you can connect multiple learning graphs together and analyse how they intersect. This can help identify inconsistencies between connected sequences of lessons. It can also help uncover broader themes of progression and highlight alternative learning pathways you might not have considered.
Find out more about learning graphs
If you’d like to find out more about learning graphs, you can download our Pedagogy Quick Read for free.
To find out more about how we use learning graphs when planning curriculum resources at the Raspberry Pi Foundation, take a look at our teaching and learning design principles.


1 comment
lanquill
This article offers a clear and practical approach to curriculum planning. I especially liked the focus on aligning learning goals with real-world skills, rather than teaching topics in isolation. The points about gradual progression and adaptability are helpful for educators working with different learner levels. Well explained and easy to follow. Thanks for sharing these insights.